One of the perks of collaborating with organizations like the United Nations is gaining awareness of the great work that is done when it comes to data toward Sustainable Development Goals (SDG). Although, this does not apply to the UN only, but also to organizations like World Bank or IMF.
Over the past years, those institutions have substantially improved their statistical methods, and their way of capturing and, providing data to measure matters that impact economies and societies. And the best: this data is public to anyone who wants to play with it and gather insight on it!
Obviously, as an economist at heart and passionate about anything that has to do with data and numbers, I could not resist getting some of those datasets and starting to learn from them.
Be curious, start with a question
If you are an analyst, you know what I am talking about. The starting point is always a question. Be curious. Ask your data and learn from what it brings.
As a woman in tech and in leadership, I am very aware that we are a rare minority over there. So, recently, I started wondering ‘How are we doing in terms of gender equality? ‘When scrolling over media, the world seems to portray quite a negative picture. I wanted to understand if things were so bad. So, one day, I came across a study that World Bank publishes on a regular basis about it – Women, Business and the Law Data. Since the 70s they have been keeping track of the interaction between inequality of opportunity and labor market dynamics. Basically, these guys have been evaluating how women’s employment and entrepreneurship are affected by legal gender discrimination, and how this impacts economic outcomes.
Get immersed in the data, start the discovery -without losing sight
One of the big challenges we encounter as analysts when facing a complex dataset is missing the wood for the trees. Literally, we get so excited with the amount of information, that we start a never-endless exploration without arriving at a meaningful conclusion. The solution sounds simpler than it is: Get hands-on with the dataset, see the multiple stories that the data is trying to tell you, and pick those that provide you answers to your initial question.
When I started in discovery mode with this dataset, I got lost for a while in the amount of information that there was -it is part of the process too. How I was going to answer my initial – basic – question in a simple way but at the same time, that provided enough context?
Well, the answer is to structure your discovery. Step by step. I, usually, break it down into sub-questions:
- What is the current scenario? And what are the current dimensions contributing to that? Or What is the current Gender Equality Score? By income group, region, economies?
- How have we arrived at that current scenario? Or How much we have improved since the 70?
- What are the key influencers contributing to my initial question? Or What are the main influencers impacting gender equality score?
The power of visualization to connect the dots
Once you got this discovery structured in a very raw way, it is time to be creative. Build a compelling story that reflects your discovery process in a simple but meaningful way. This can be a bit of a challenge, as you need to connect the dots and turn complexity and technicalities into something easy to understand.
Keep in mind that if you plan to share your discovery with others, they -most probably -have not spent the same time you have spent in that discovery process. KISS. A good data insight is one that can be understood at a glance.
My tool to go in Power BI. When developing dashboards, it feels like a painter with a white canvas, with different colours and brushes, ready to create that picture that explains in a compelling way all the hours in my data discovery.
So, in our quest towards understanding gender equality, Power BI is, too. Features like visual tooltips when scrolling over the different groups of interest – income group, region -, the cool map – that once you click it zooms areas -, the key influencers – an AI regression that explains those attributes contributing to increase/decrease the gender equality score… are difficult to compete against it!
Take action, sharing is caring
What’s the point to go through this quest to gain insight if you do not take action? Sharing what you have learned, allow your audience to experiment with the dashboard you have built and, gather feedback – to keep iterating better in your next adventure for answers.
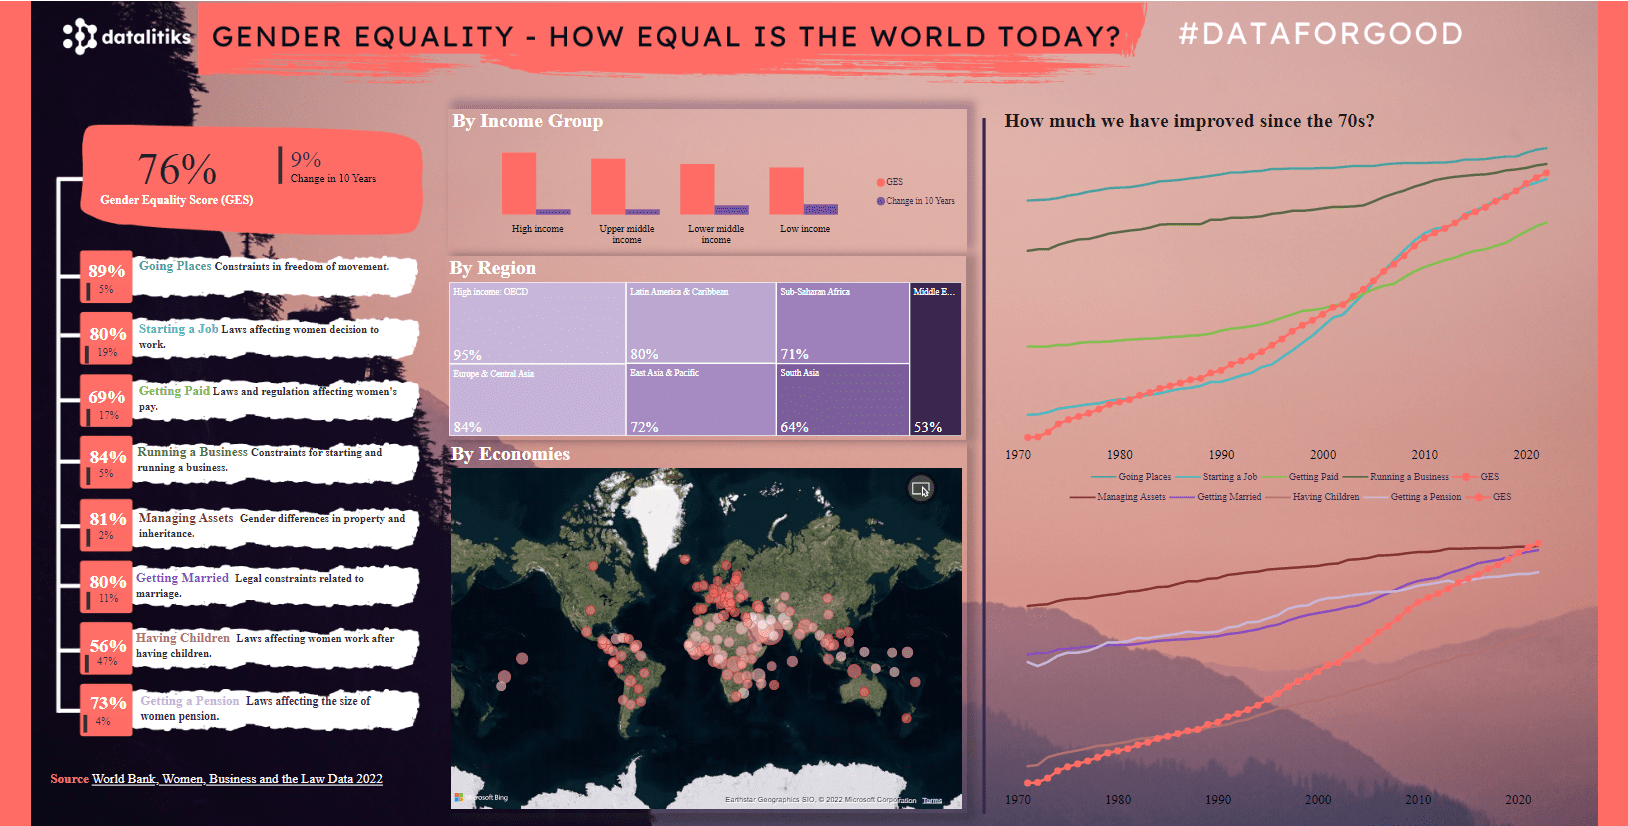
The below summarizes my quest toward understanding ‘How equal is the world when it comes to gender equality?’
I invite you to spend 10 minutes going through the dashboard, use their interactivity to learn, and share whatever data insight you picked. Sharing is caring. Creating awareness on topics such as gender equality – which is part of the SDG set by the UN – is one step on contributing to creating a better world. Join the cause!
For me, those were the key insights I gathered, what are yours?
- There has been a considerable improvement over the last 10% years towards gender equality, resulting in an overall score of 76%. This pretty much tells me that my initial perception was wrong, and things are not as bad, as we might see in the media.
- Laws affecting women’s work after having children (56%) or laws and regulation affecting pay (69%) needs to be improved if we want to do better in the next years.
- Part of the improvement over the past years has been thanking the development experienced mostly in economies in Asia and Africa. – Check Arabia Saudi!
- Last, but not least: Did you know that the top cause to increase the Gender Equality Score is to remove any Laws that force women to obey its husband?
Stay tuned for more, reach out if you want to know more about how to use data to create awareness towards sustainability. #dataforgood.